USCOTS Presentation: “Where do students struggle on programming tasks in Data Science 101?”

This research analyzes student performance in the Data Science Foundations zyBook to identify common areas of difficulty in programming tasks. The study, conducted between September 2024 and June 2025, used two metrics to measure student struggle: time spent on a task and number of attempts until correct submission.
Programming in Introduction to Data Science Courses: Python or R?
One of the first choices a data science instructor has to make about their course is programming language – should you teach using Python, R, or something else? Python is one of the most widely used programming languages. But, R is considered the “language of statistics”, and an essential skill in a data scientist’s toolbox. So – where should you start?
At zyBooks, we offer three versions of the Data Science Foundations (DSF) zyBook – Python, R, and non-programming. For all three books, the conceptual content is identical, so students are learning the same core ideas and skills. The programming versions have similar, but not exactly identical, content teaching popular data science libraries like scikit-learn, pandas, dplyr, and tidymodels. As part of our continuous improvement efforts, we recently compared student performance on challenge activities (CAs) in DSF Python and R, to see if students are truly struggling more with a particular language.
Measuring Student Performance
We measured student performance on CAs using two metrics:
- Average time to completion: Students who are taking longer to complete a level may be struggling more.
- Number of attempts until first completion: Students who need more attempts to complete a level may be struggling more.
We recorded data on student performance for DSF zyBooks created after September 1, 2024. Since instructors can choose which sections to assign in a zyBook, sample sizes vary from 1,500+ students to 20 students per CA level. All student data from the zyBooks platform was completely anonymized for this project and aggregated across schools and courses, which provides a unique view into introductory data science courses beyond a single course.
Conceptual Challenge Activities – No Difference between Python and R
First, we wanted to assess student performance on conceptual CAs, which are identical in both versions of DSF. As expected, we found no significant differences. Conceptual CAs had a strong positive correlation between performance metrics in Python and R – tasks were “hard” for students in both versions, or “easy” in both versions.
Programming Challenge Activities – Some Programming Tasks are “Harder” in Python vs R
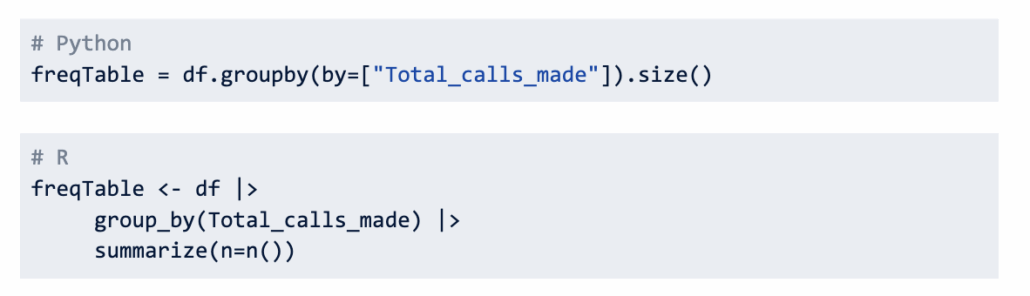
Since syntax varies – length, functionality, etc. – between Python and R, programming CAs aren’t identical in the two versions of DSF. Before analysis, we reviewed and matched programming CAs based on task, complexity, and logic. Ex: Although the code differs, creating a frequency table in Python and R requires students to identify a grouping feature, then calculate the sample size for each level of the group.
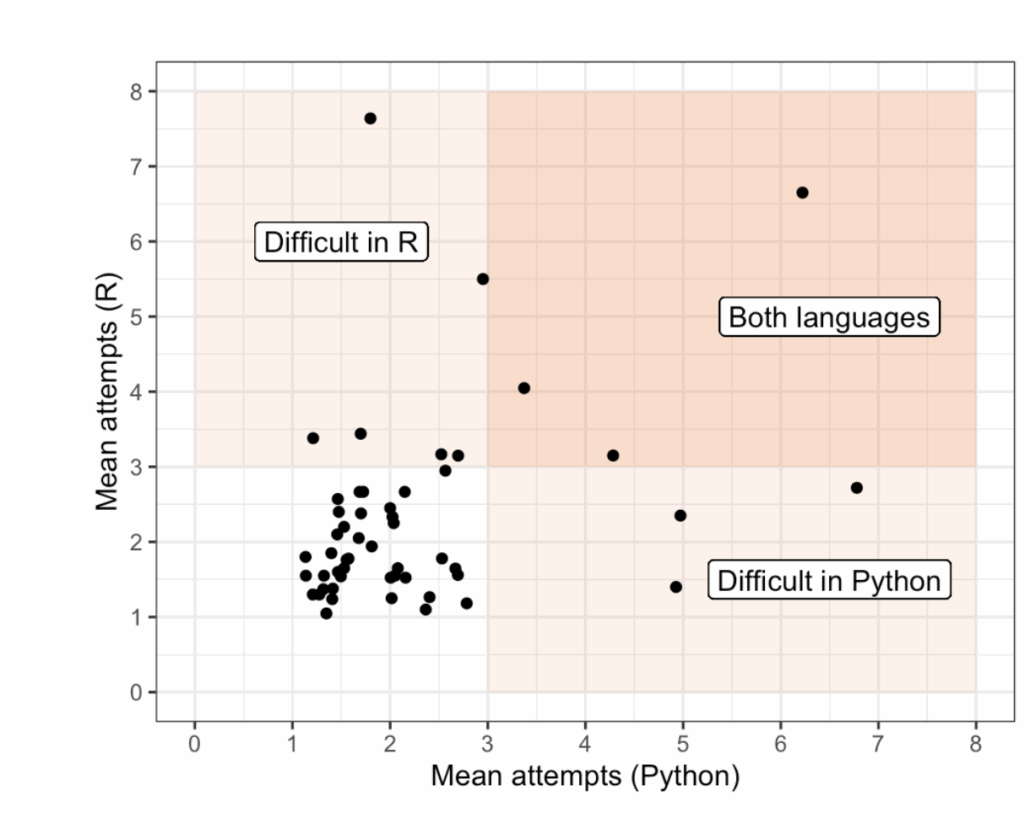
We identified 54 matched CA levels in DSF. We categorized a CA level as difficult if the mean number of attempts until first completion were greater than three. 11 matched CAs were difficult in at least one language.
Difficult in R, but not Python
- Calculating binomial probabilities
- Two-sample t-tests
- Contingency tables
- Fit a linear regression model
- Fit a logistic regression model
- Fit k-nearest neighbors
Difficult in Python, but not R
- One-sample proportion test
- Define cross-validation folds
- Fit PCA and calculate eigenvalues
Difficult in both
- Frequency tables
- Imputation
- Find predicted values and slope for linear regression
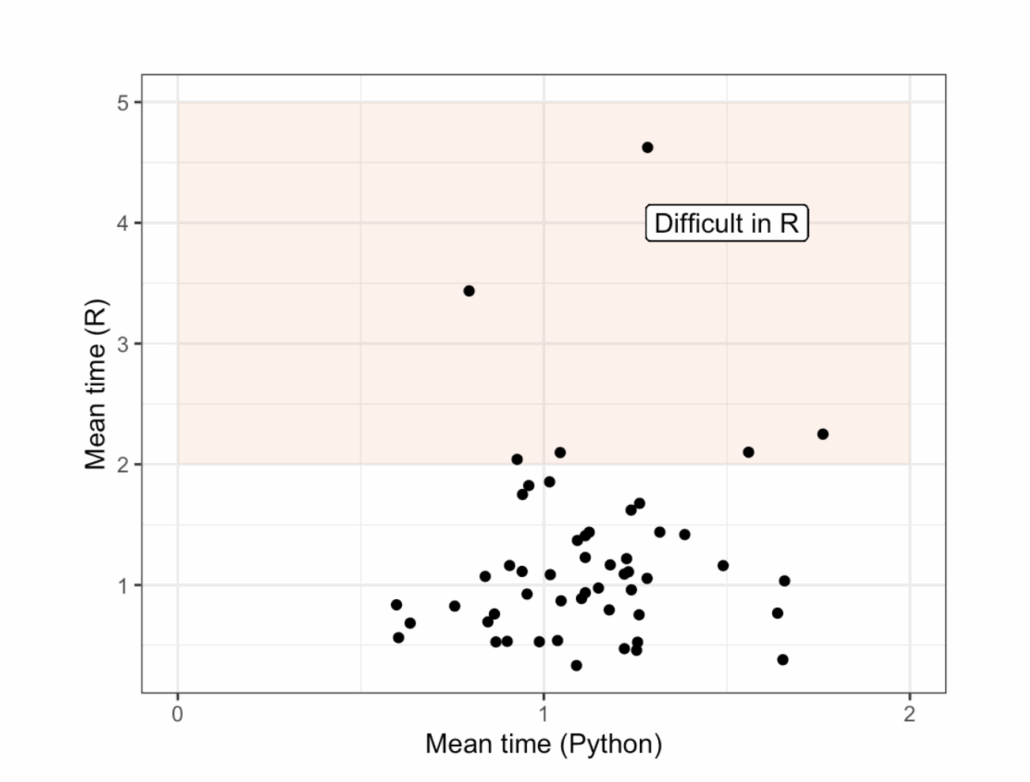
We categorized a CA level as difficult according to time spent if the mean time until successful completion was greater than two minutes. None of the programming CAs took more than two minutes in Python, but we saw several CAs that took longer in R.
- Calculating binomial probabilities
- One-sample proportion test
- Generate bootstrap sample
- Normalize input features
- Subset a dataframe
- Fit a support vector machine
Are certain programming tasks actually harder?
We noticed an interesting pattern with difficult programming tasks – they tended to coincide with the first introduction of a library or framework. Tasks that also required “by hand” calculations, like using a function’s output to calculate a new value, tended to be more difficult. For example,
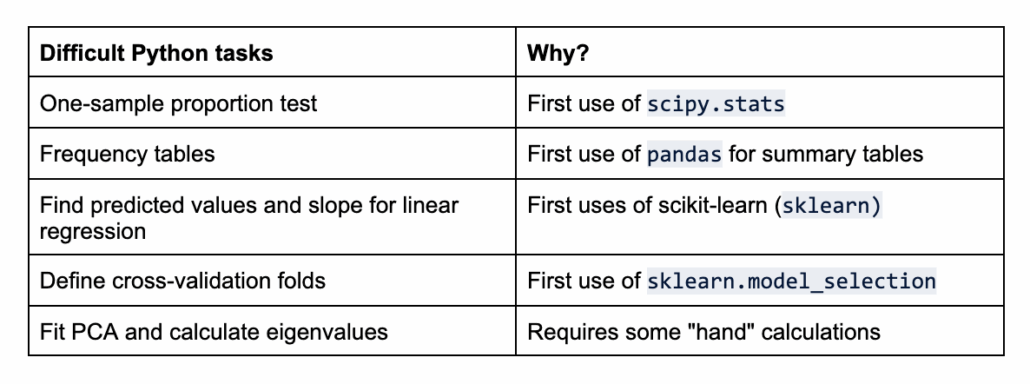
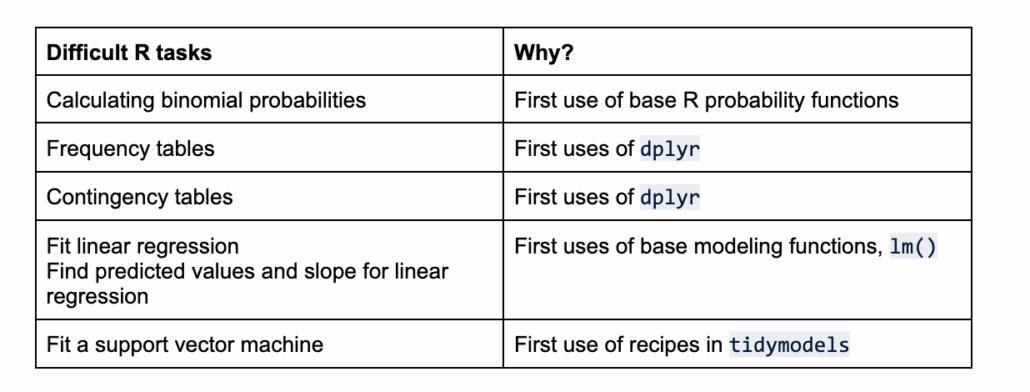
Since zyBooks are highly customizable, not all students are completing all content in the same order. However, our research generally suggests that students struggle most when a new library or syntax is introduced, regardless of the language.
Check out our recent poster from the US Conference on Teaching Statistics (USCOTS):